


The Hiatus
2019.
A year of planning.
A year of swapping coasts.
A year of transition.
A year of…well, not blogging. But there were reasons.

Boston.
We, my fiancé and I, knew this year was coming. Neither of us were from Boston, nor did we have family in the area, but it was home. Boston is actually the longest place I have ever lived – 9 years – having spent my adolescence on the move due to my father’s service in the Army. My family and I visited Boston while I was an undergraduate and I immediately felt drawn to the city. The history, the universities, the hospitals – there really aren’t many better places to continue learning and begin your career if you’re interested in healthcare. I was fortunate to work at one of the nation’s leading cancer centers, Dana-Farber Cancer Institute, and one of the best hospitals, Brigham & Women’s Hospital.

Our old view: looking out at the Zakim, Harbor, and TD Garden.
Time.
It is a fickle thing, and we need to make the most of it. We acknowledged the need to be near family. Despite being accustomed to resettling, it was going to be an interesting change moving from a city in New England to the suburbs in the San Francisco Bay Area. Heck, I was going to need to learn how to drive again! Well, not really, but I hadn’t owned a car in almost a decade. Good news: no accidents to report as of now (knock on wood).
Silicon Valley.
Not the HBO show. The real one. I put out my resume rather early in 2019 just to test the market in the Bay Area. I was intrigued – Silicon Valley! I was fortunate enough to get some interest and, after a couple phone screens, I was flown out for a couple of interviews. The next part might sound like a weird thing to “complain” about, but it was a stressful time. I ended up receiving a few offers. I had never been in this position before. It was difficult as I was unfamiliar with the area itself, not in a rush to decide, and, despite the allure of the Valley, I love healthcare. Despite all of its flaws, I feel that healthcare data is interesting and can actually make a big impact on the lives of everyone. I ultimately decided to stay in the industry rather than add to the stress of a move, a renovation, wedding planning, etc.


Drive.
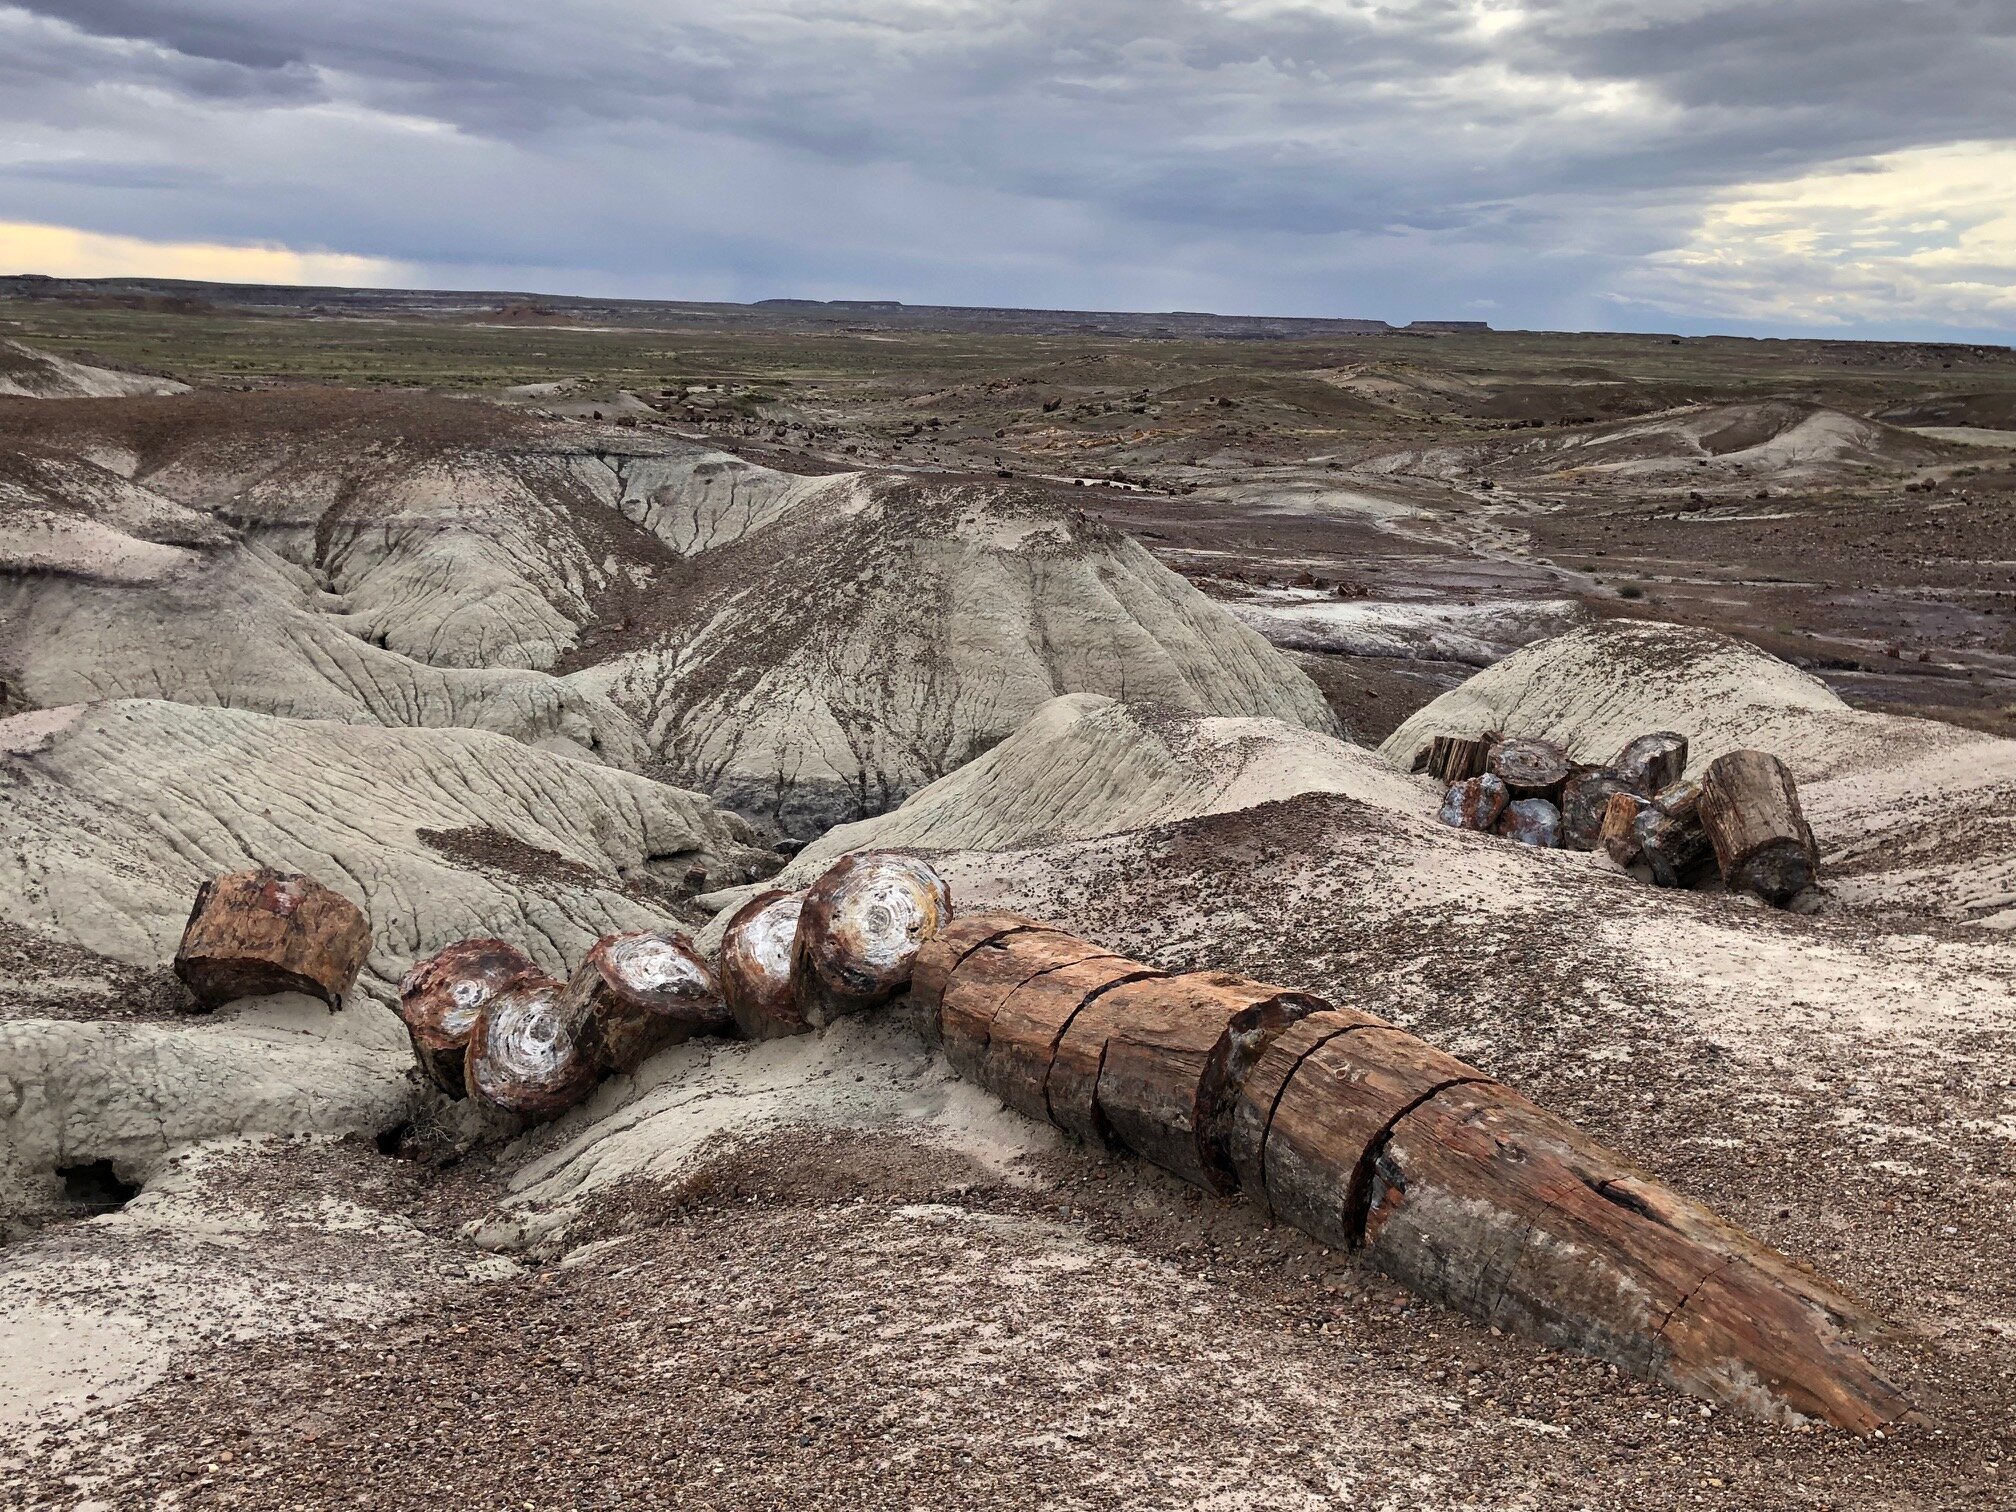
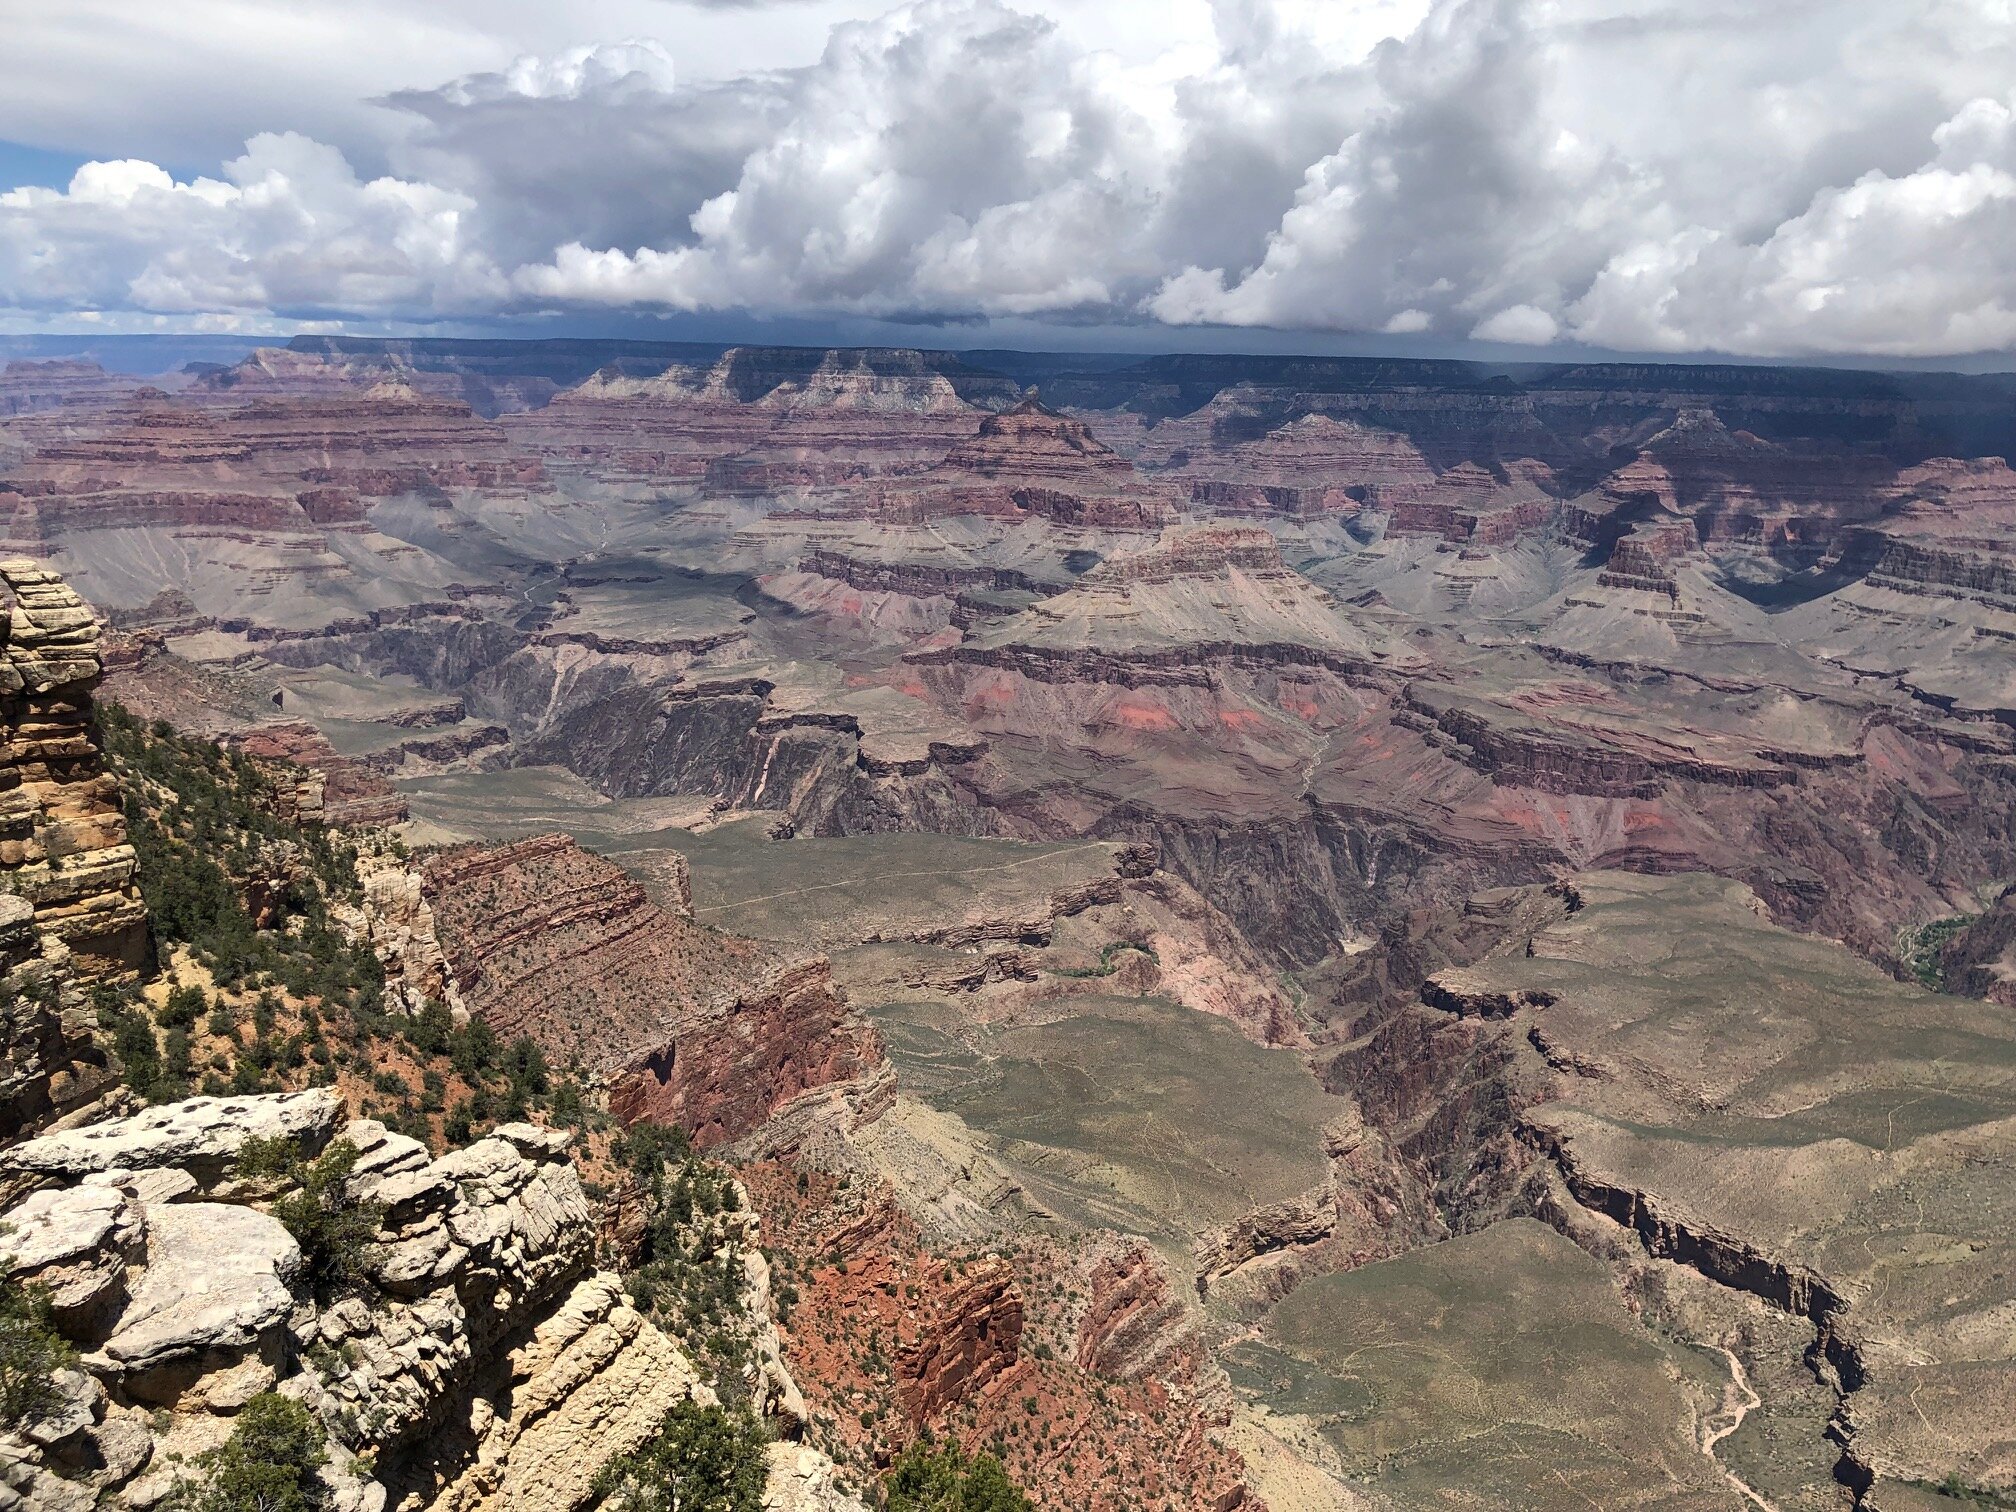
And drive. And drive. We loaded up the car and hit the road. Cross-country with our dog on an 8-day journey. If you ever have the time, I really do recommend exploring other parts of the country by ground. I wish we could have taken a bit more time, but we made sure to visits friends and family along the way, as well as cities and National Parks. The views and experience definitely made it, in the end, one of the most memorable weeks of my life.

New Stanford Hospital
Stanford.
I landed in Palo Alto at Stanford Health Care. The role was intriguing: Visualization Developer. Our team focuses mostly on projects for the C-suite executives and directors. And we’re able to work remotely half the week. Vital having been acquainted with traffic on the 101. The only thing I had reservations about: the tool.
After spending years working with Tableau, I was going to have to pick up a new tool: Qlik; the enterprise standard at SHC. I came in with an open mind. I’m more than willing to learn something new; in fact, it’s something I enjoy! The hardest part was learning it on the job. I highly recommend companies invest in their people – send them to some formal training. However, I knew I could figure out my “end goal” using a whiteboard, post-it notes, PowerPoint, etc., and make my way there. Thankfully, there was another visualization developer within the department, and he has been an immense help when I’m struggling. And there has definitely been moments of struggle – the syntax isn’t really like anything else I’m accustomed to. Now 7 months in I’m pretty comfortable with it while acknowledging there are definitely areas I want to improve in. However…
Pockets.
Like many organizations, there are pockets of analysts throughout Stanford Health Care. This was not a secret. And, despite Qlik being the enterprise standard, some groups found it too cumbersome to use. I agree – if you’re not very technical (and even if you are) – it can be difficult to use. I actually think the backend of Qlik is excellent. It’s very powerful and I understand why it’s the choice for many enterprises and their reporting needs. However, you definitely need to have some technical know-how as there isn’t really any drag-and-drop or WYSIWYG interface. Aware of this, there was a committee that brought several of these groups together to see who was using what and why.
Tableau.
After several meetings with all these groups and a market analysis, it was ultimately decided to begin our transition to Tableau as the enterprise business intelligence tool. I may or may not have been able to hide my grin when this was announced. I know the ease of use for varying levels of technical ability. And how easy it can be to create your desired output. There are certain things I’ve learned from Qlik that I wish Tableau would have implemented by now, but for those I’ve been vocal in the Ideas section of the Tableau Community page. To keep my skills fresh, I tried to remain active in the Forums as well, which saw me achieve Data Monarch status (huzzah!). I was also lucky enough to be permitted to attend TC19 in Las Vegas. This was my third Tableau Conference, but first in a company where Tableau wasn’t rolled out yet. I felt the need to focus my sessions on enterprise implementation and developing a data culture. Between those sessions, the #data19challenge (h/t Nicole Lohr; (my thread here), our internal committee discussions, and speaking with members of the #datafam community, I couldn’t be more excited to about this process. More to come on that in future posts.

Community.
Many have said it, but it’s true. The #datafam Community is what makes Tableau so great. I was mildly active last year, but I have made it a point to connect with others this year. TC19 was also the first conference where I met with others from the online community and there’s no better way to make connections. While at dinner with a fairly large group, Zach Bowders commented: “you came out of nowhere; now I see you everywhere.” I guess that means I’m off to a good start. (Also, stay tuned for his new blog/podcast).
But really, putting a face to a twitter handle: priceless. I have relished those new friendships since: asking for feedback, sharing ideas, etc. Don’t be afraid to get involved. Put yourself out there. Reach out to others.
Thank you for welcoming me (back).
2020.

Data Pool. TC19.


