WoW | 2019W03
#WorkoutWednesday2019
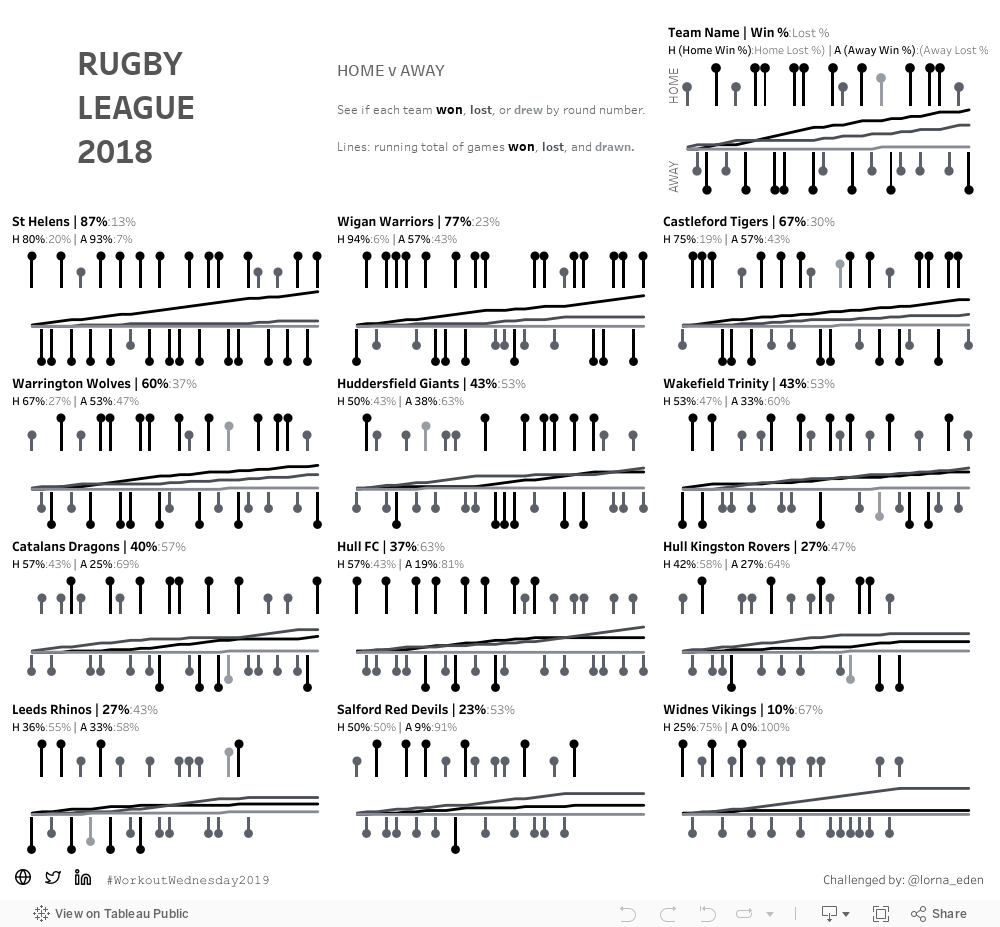
W03 - 2018 Rugby League Home and Away
At last, I can do a true small multiple viz. Sure, I’ve done the same chart per different dimensions, but nothing like this. This served as a good opportunity to learn more about the methodology. First stop like any good analyst or developer: Google. Then, like many others, I ended up on an Andy Kriebel’s post and got the calculations for columns and rows.
Small Multiples
When creating a small multiple you typically want things to be presented as a square.
Example: say you have 16 stores you’re plotting data for. You want these to be presented in a 4x4 grid. How can you get this? Simple: square root. √16 = 4. Let’s use this example throughout.
Column
(index()-1)%(round(sqrt(size())))Size: counts items in viz when using the dimensions in table calculation (16 stores)
Note: the first item in the table calc (“specific dimensions”) needs to be the parent dimensions; in other words, order them hierarchically
Round Square root: makes it a friendly integer and helps to create the “square” view (4 columns)
Index: order of your items (1st store, 2nd store, 3rd store…)
Modulo: divides order of items by the rounded square root of the item count to put in columns left to right; first item in your index/rank is assigned 0, second team assigned a 1, and so on up to the rounded square root of the item count (in this case, it’s N%4, so 0, 1, 2, 3 repeating)
Row
int((index()-1)/(round(sqrt(size()))))Size: (16 stores)
Round Square root: (4 rows)
Index: (1st store, 2nd store, 3rd store…)
Int: divide order of item (minus 1) by rounded square root of the item count and truncate (0/4 = 0, 1/3 = 0, etc. so they’re on the same row. Once index is a multiple of the rounded square root of the item count, you get a new row; 4/4 = 1, 5/4 = 1, 8/4 = 2, 9/4 = 2, etc.)

If desired, you could decide to sort Stores based on sales or the like to get desired order

Here the Stores are sorted in alphabetical order and Columns/Rows are computed using Stores.
Using this methodology you can accomplish this week’s Workout Wednesday. The lollipop charts are created as expected: circle and bar charts with synchronized dual axis. These are separated by Measure Names/Values: running totals of wins, draws, and losses.
The trickier part is the team label and stats which utilizes a methodology I often find myself using: AVG(1). In this case, we change the mark type to a line so it stretches across the viz. Drag all the info you want to display onto the text label and check:
Allow labels to overlap other marks
Label start of line (and change text alignment to “Left” so it’s as far left as possible)
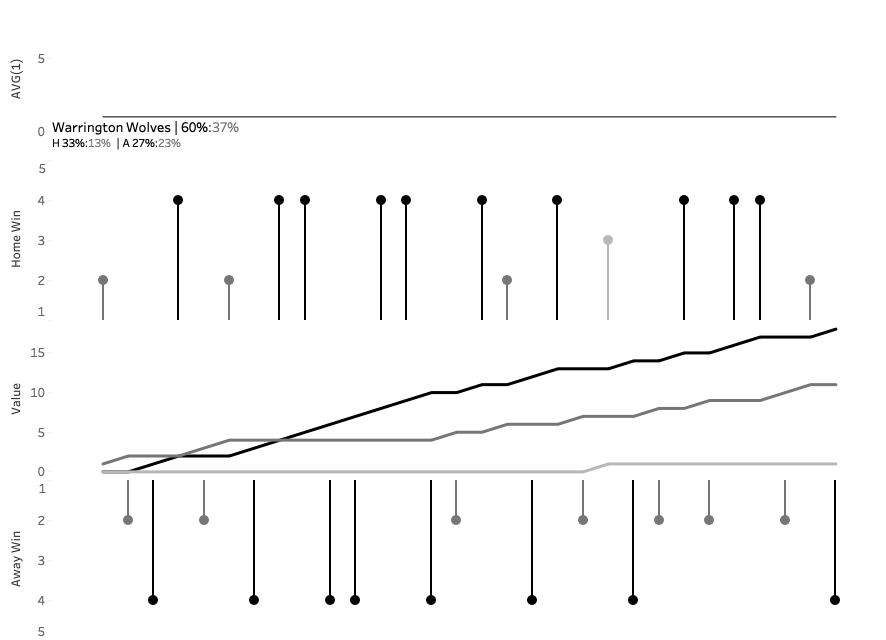
To clean it up, change the AVG(1) line opacity to 0% so it appears just as text! And then, of course, hide headers to get a clean viz.
Image and dashboard belo!