WoW | 2019W02
#WorkoutWednesday2019
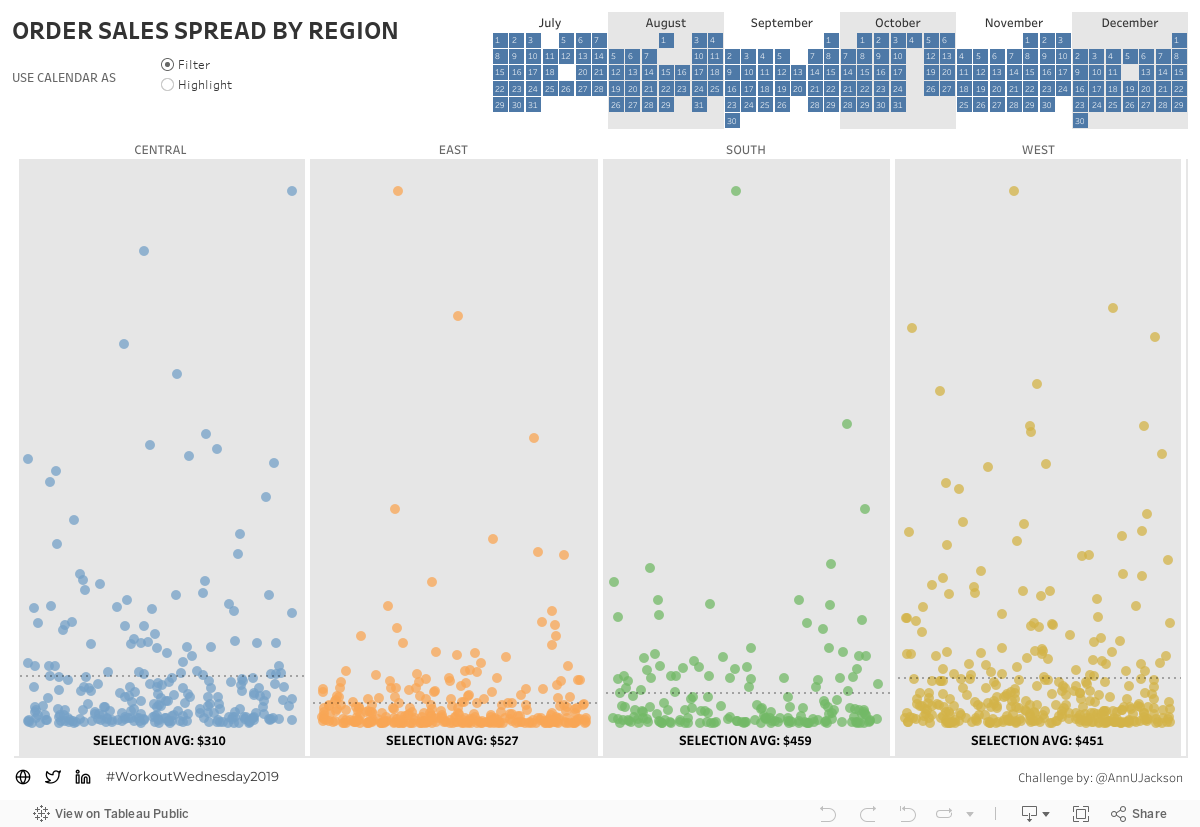
W02 - Order Sales Spread by Region
Jitter plot! I’ve seen this chart type in many books, but admittedly have never had the use case at work. Immediately this visualization jumps off the page with the aesthetics of the jitter plot and the familiar feel of the calendar. Tricky item: allow users to filter or highlight.
Calendar
Let’s start with the calendar. This is something I actually recently built in Excel while helping another team with VBA code. There a few key things to know:
Month name
Weekday #
Month Week #
First two are simple: DATENAME(“month”, [Order Date])¹ and WEEKDAY([Order Date]), respectively. Unfortunately for the last item we need to do a small calculation. The easiest way to find the Week # of the Month is to find the week number of the Order Date and subtract the week number of the first day of the month (I add 1 so it doesn’t start at 0, but hardly necessary).

Now that we have this information we can build the calendar view by making the Marks Square to look similar to a normal calendar. If we really wanted to, we could look to blend this dataset with a datasource full of dates and color the days when Orders were placed. I went ahead and added the day of the month on the square in attempt to help guide users. Admittedly, this may be overkill, but thought it could be useful.
![Date Filter: DATEADD("month", -5, DATETRUNC("month", [CF_OrderDate_Max])) <= [Order Date] AND [Order Date] <= [CF_OrderDate_Max] //LOD {MAX([Order Date])}](https://images.squarespace-cdn.com/content/v1/5bd4e574da50d319c6aef37f/1547241390056-CGJFMGZVNO9AWV288Y2R/WOW2019W02_Calendar)
Date Filter: DATEADD("month", -5, DATETRUNC("month", [CF_OrderDate_Max])) <= [Order Date] AND [Order Date] <= [CF_OrderDate_Max] //LOD {MAX([Order Date])}
Jitter Plot
Beautiful! Now onto the jitter plot. Per Ann Jackon’s request each region must have an independent axis. Another way to think about this: normalization. In some vizzes I alter the min/max to be 0/1 respectively, but for this I just wanted the max value to be 1 and everything else proportional.

Once we have Region on Columns, the normalized Sales sum on Rows, and the Order ID on the detail pane we can see the viz starting to take shape, especially with Region on the color card. Let’s spread these points out and create the jitter. I’ve chosen to follow methodology explained here by using the (hidden) RANDOM() function which assigns values between 0-1 (important to remember this later).
Filter vs Highlight
Here comes the tricky part (or one of them): allow the user to decide if they want to filter or highlight Order Dates using the calendar. I’ve opted to use an integer parameter (Filter and Highlight as 1 and 2, respectively), but you could use a string list, a boolean, or whatever floats your boat. How do we utilize the calendar? Set Actions. Let’s create a Set based on Order Date by right clicking on the field, creating a set, and selecting any day for now. Navigate to the dashboard to put into action:
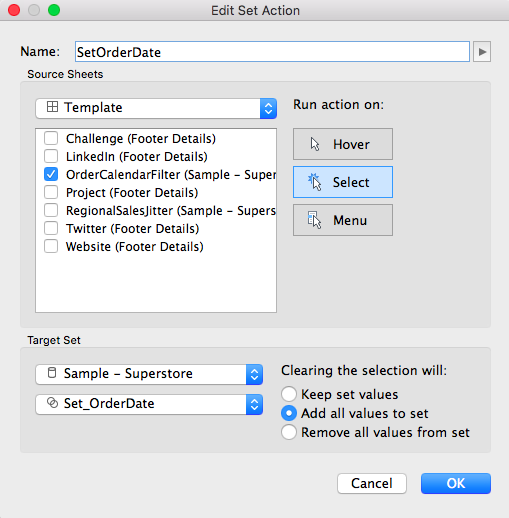
Note: Add all values to set is important as to bring back all values after deselecting a date!
So now what? We want to filter all values when the user selects Filter and make the others stand out when they select Highlight. Notice how I said we want to make them stand out vs. actually highlight? As such, we know we only want to bring in the selected Order Date(s) when filter is selected or keep everything - a pretty simple calculation in the end.

Only filter when…Filter is selected!
We can make drag this onto the Filters and only keep TRUE (note: you should have the same date filter here s the calendar). To make the points stand out when Highlight is selected, let’s drag the Set we created onto the color card as well (or drag to detail and then change to color). Change the parameter to Highlight and you should see this in effect. You will need to ensure your Sales Normalization field takes this into account now as well!

Footer
To me, this was honestly the trickiest part even if it wasn’t meant to be! There was one thing I knew: create a fake measure (MIN(0)) in order to put the label at the bottom (after aligning axes), but formatting was going to be tricky. But first things first: the Average Sales calculation.
We want the label to take into consideration values we have filtered or the value we are highlighting. In essence, the values in the set. A key advantage of Sets is the ability to use them as booleans in calculations.

We can drag this onto the label field of the pseudo field and add appropriate formatting. Change the circle mark’s opacity to 0% for this measure and move marks to back. But…
Problem. The horizontal alignment of this field is chaotic. Why? We’re using RANDOM() to plot things on the X-axis and this causes it go everywhere. Wow. What to do…?
Admittedly, at this point I did download Ann’s workbook to see what she did. INDEX(). Wow. I didn’t think about that. With this you spread out every Order and the MIN(0) will be assigned a 1. Brilliant. Then you can add some spacing to make it look nice. However, I really wanted it to be centered. Perfectly centered.
Solution. This came as an epiphany after I stepped away, naturally. With the jitter being 0-1, the center is 0.5. How can we get the label there? Well, the jitter has Order ID as a unique point, but this isn’t the case for the label. So, we can compare the Order ID to itself using min and max. If these are equivalent, use RANDOM() or use 0.5!
Bonus. If you can make the fist line of code below a table calc, please let me know!
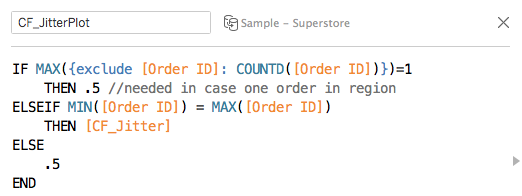
CF_Jitter is simply the RANDOM() calculation from earlier.

Now we have the Average Sales nicely in the middle of our regional sales!